Olympic Venue Traffic Impact Analysis
This analysis compares current traffic levels with projected Olympic-period traffic for key venue areas based on LADOT traffic count data.
Traffic Impact Analysis: Based on LADOT traffic count data, we project a 50% increase in traffic volume around Olympic venues during the 2028 Games. The chart above shows current average daily traffic counts compared to projected Olympic traffic for major venue areas. USC and UCLA campus areas show the highest raw traffic volumes, while all venues will experience significant percentage increases during the Olympic period (July 14 — July 30, 2028).
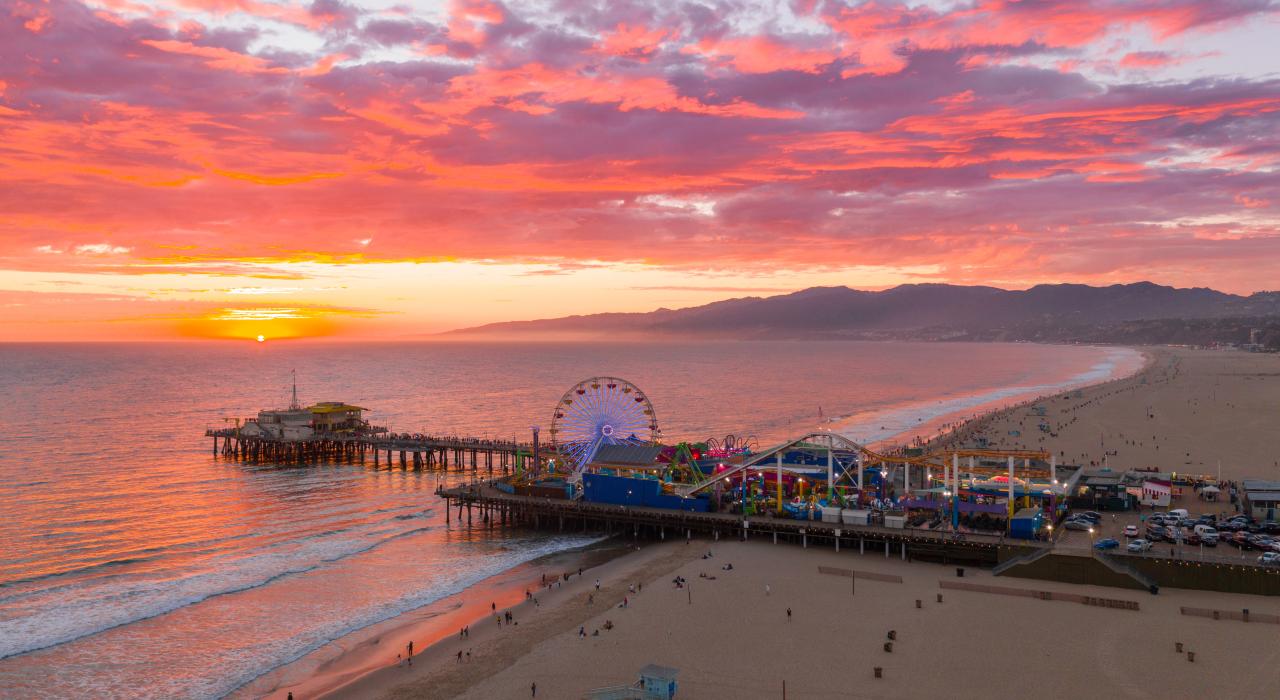
Santa Monica Beach
Traffic around Ocean Avenue shows moderate volumes currently, but the narrow coastal roads will be heavily impacted by the 50% increase during beach volleyball and other coastal events. Consider Metro's Expo Line as an alternative.
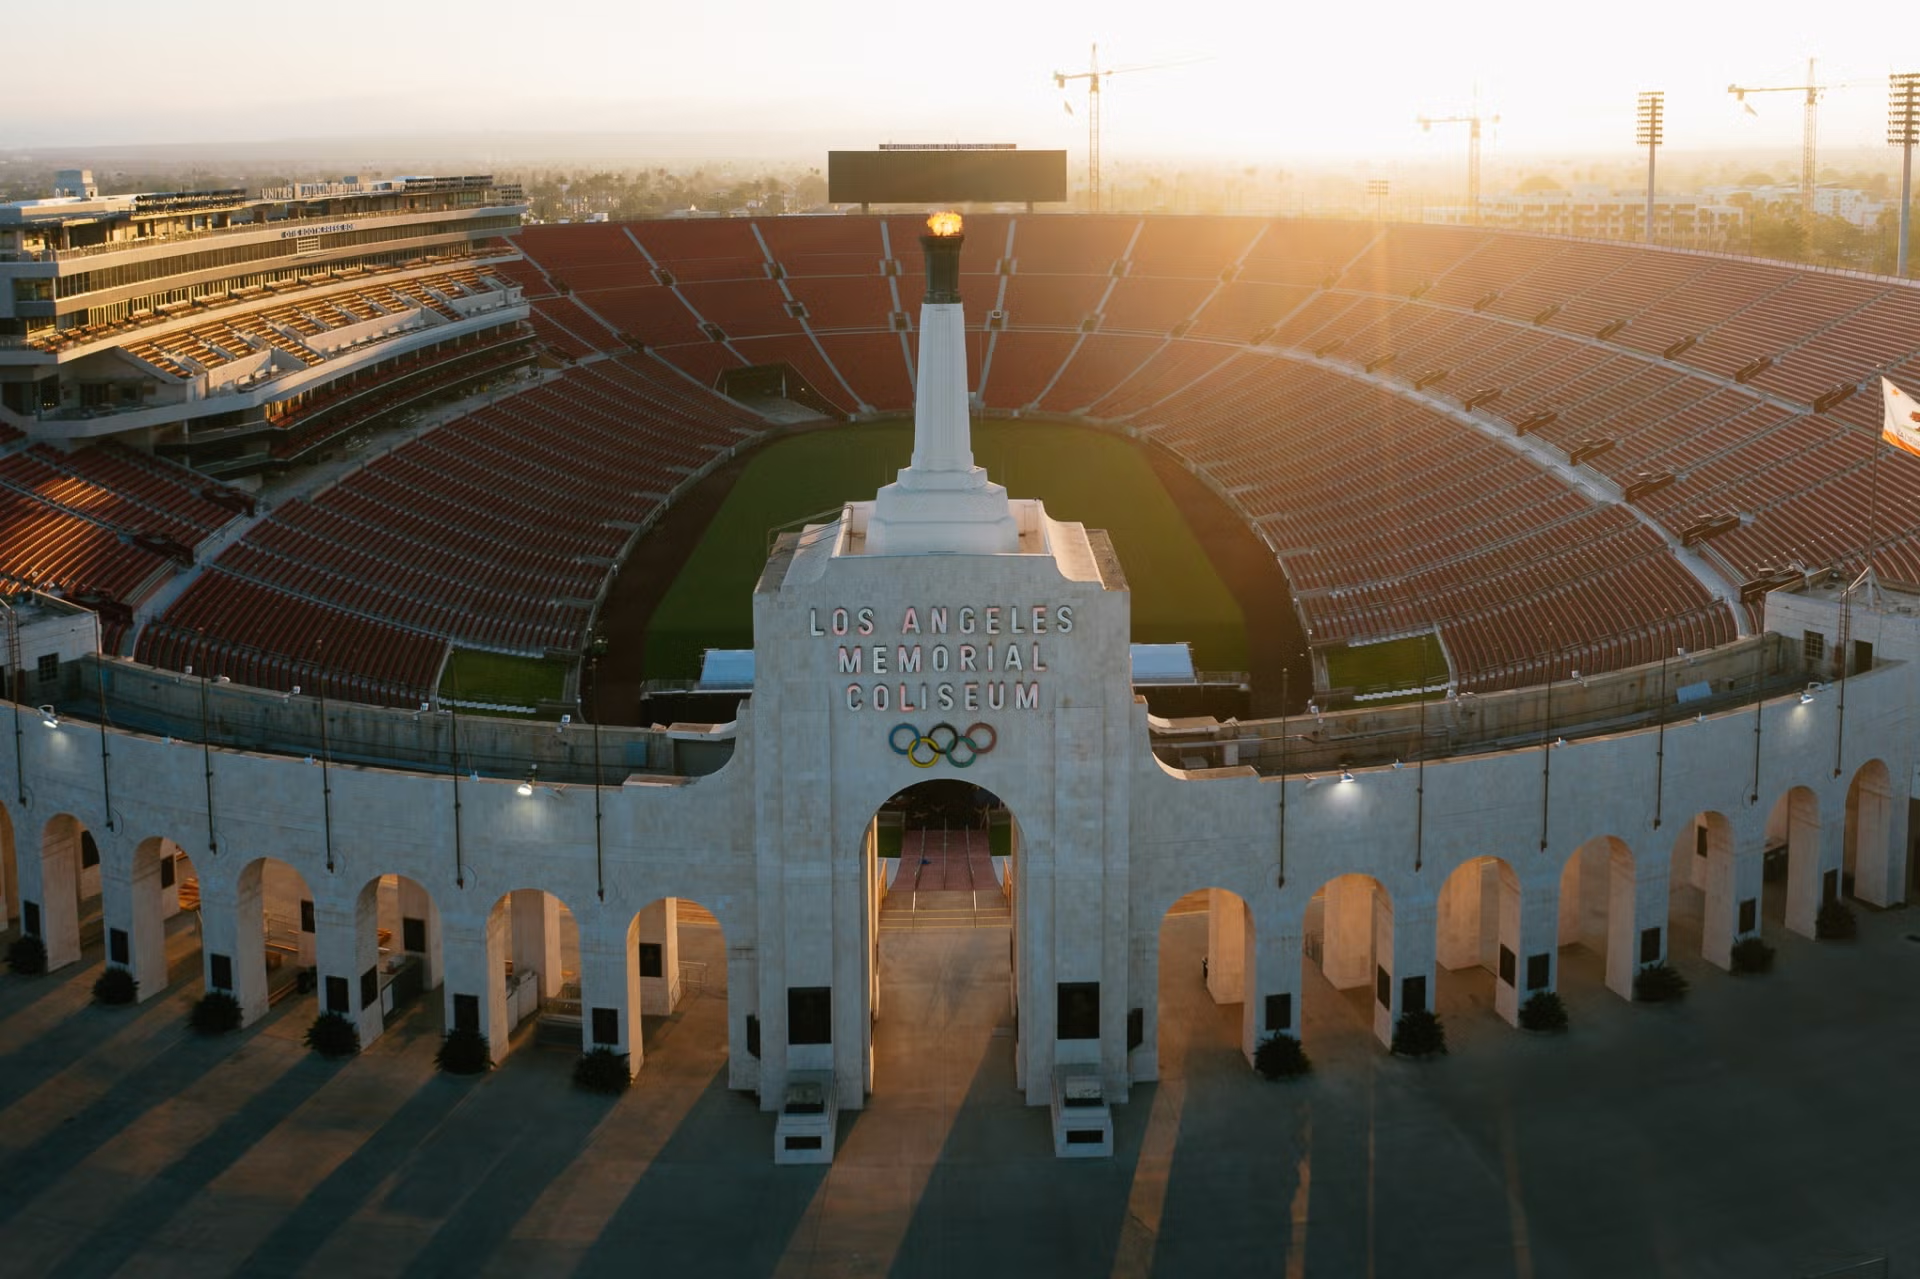
USC Campus Area
Figueroa Street near USC and the LA Coliseum already experiences substantial traffic. The projected 50% increase will significantly impact this major corridor, which connects multiple Olympic venues.